


TextIO 效能
以下圖表顯示使用 TextIO 從 Google Cloud Storage 讀取或寫入資料時的各種指標。請參閱術語表以了解定義。
讀取
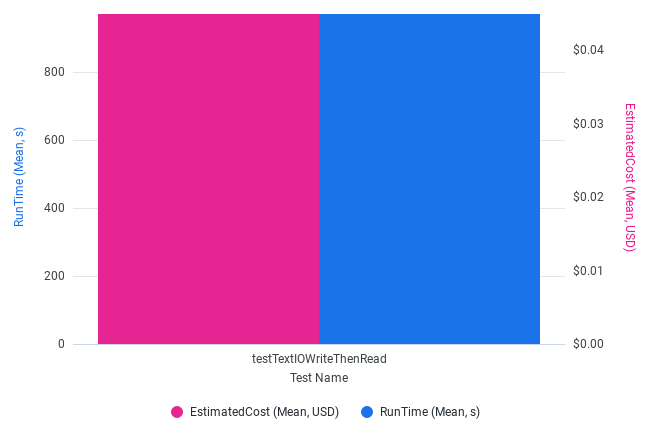
使用 TextIO 從 Google Cloud Storage 讀取資料的預估成本是多少?
讀取 TextIO 執行時間和預估成本

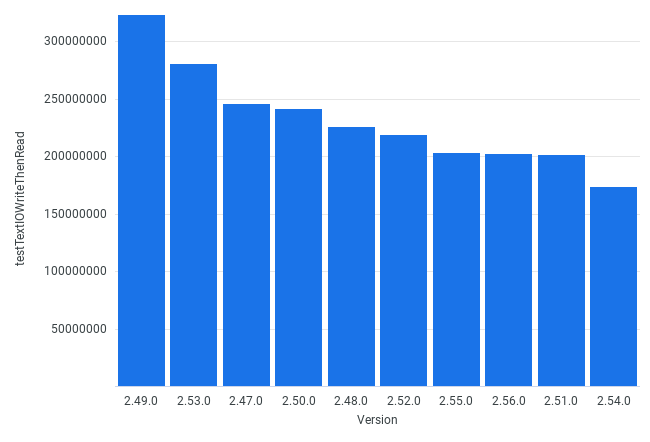
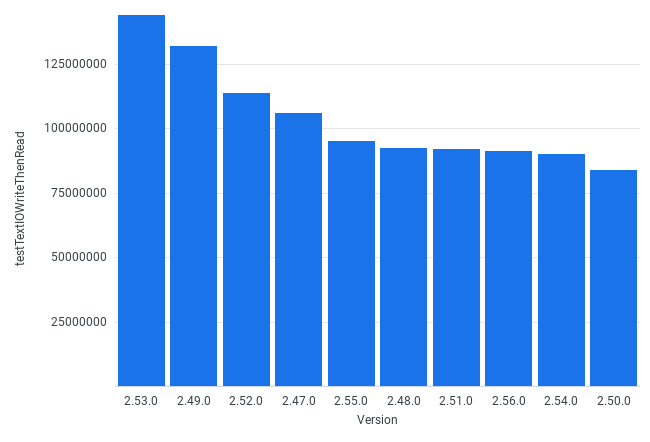
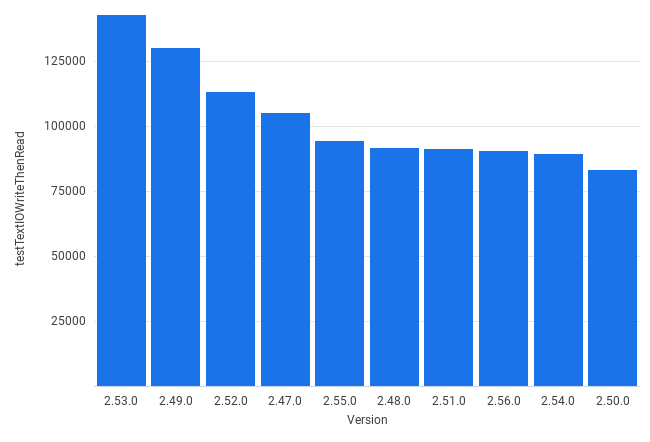
針對不同 Beam SDK 版本,使用 TextIO 從 Google Cloud Storage 讀取資料時,各種指標如何變化?
依版本劃分的平均輸出吞吐量 (Bytes/秒)
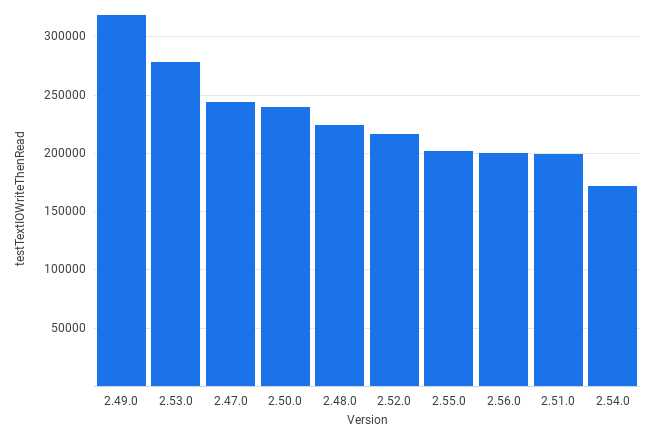
依版本劃分的平均輸出吞吐量 (Elements/秒)
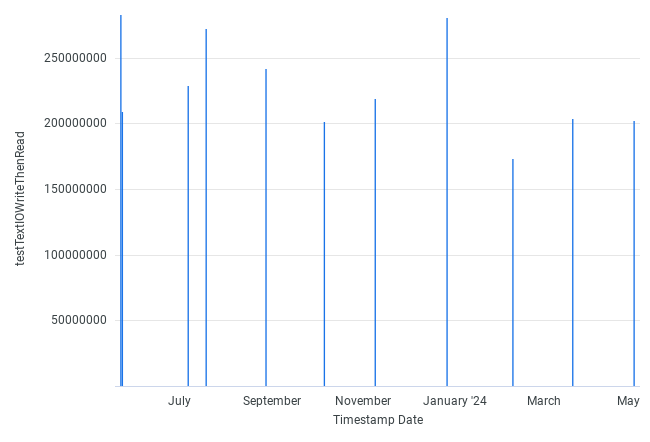
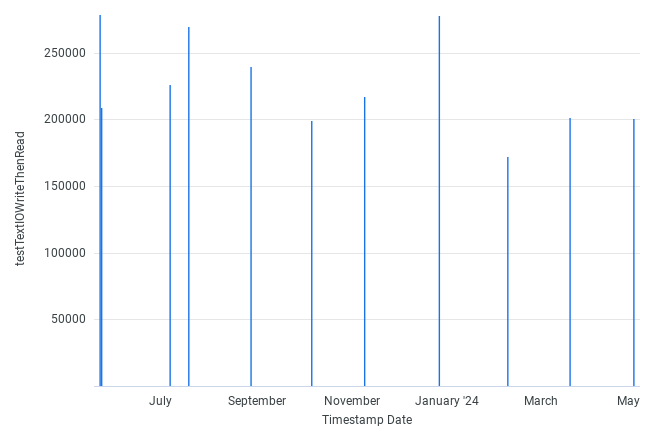
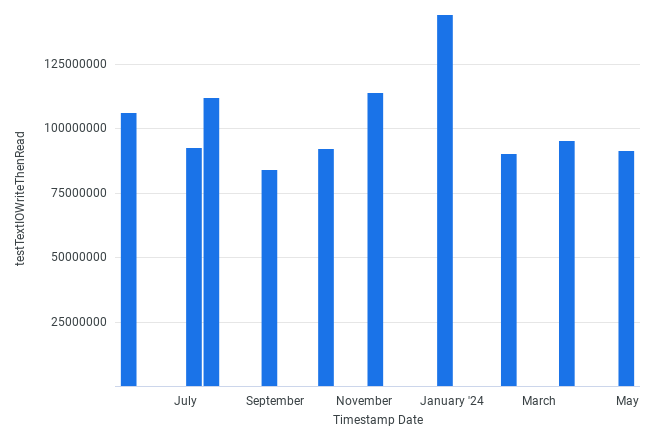
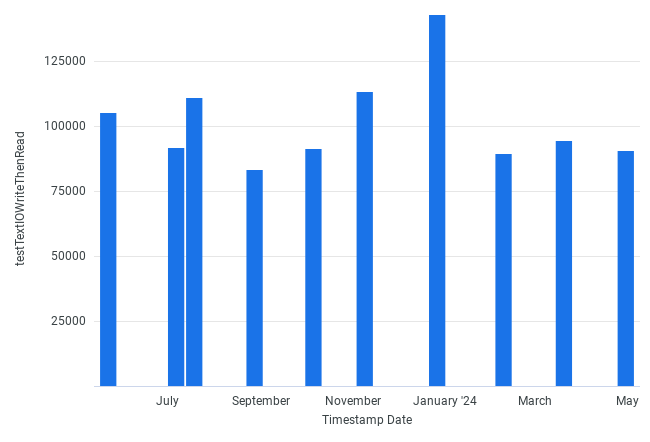
隨著時間推移,使用 TextIO 從 Google Cloud Storage 讀取資料時,各種指標如何變化?
依日期劃分的平均輸出吞吐量 (Bytes/秒)
依日期劃分的平均輸出吞吐量 (Elements/秒)
寫入
使用 TextIO 寫入資料至 Google Cloud Storage 的預估成本是多少?
寫入 TextIO 執行時間和預估成本
針對不同 Beam SDK 版本,使用 TextIO 寫入資料至 Google Cloud Storage 時,各種指標如何變化?
依版本劃分的平均輸入吞吐量 (Bytes/秒)
依版本劃分的平均輸入吞吐量 (Elements/秒)
隨著時間推移,使用 TextIO 寫入資料至 Google Cloud Storage 時,各種指標如何變化?
依日期劃分的平均輸入吞吐量 (Bytes/秒)
依日期劃分的平均輸入吞吐量 (Elements/秒)
上次更新於 2024/10/31
您是否找到了您要尋找的所有內容?
所有內容是否都有用且清晰?您有任何想要變更的嗎?請告訴我們!